Gallery
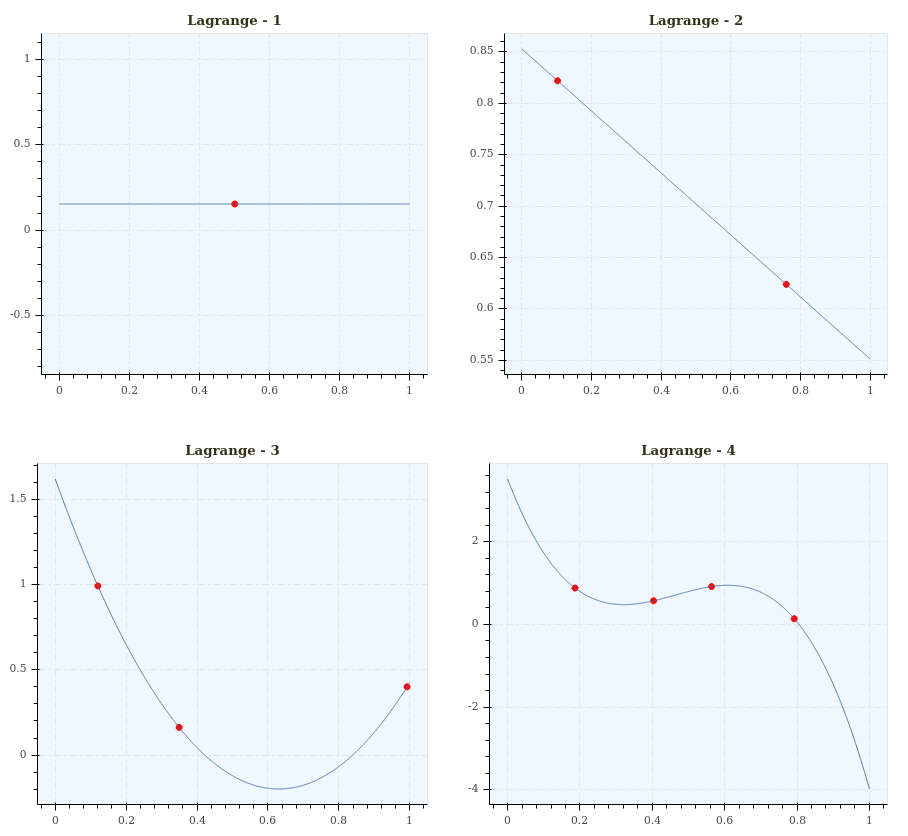
import depict
import numpy as np
import scipy

p_all = []
for i in range(1, 5):
    x = np.random.rand(i)
    y = np.random.rand(i)
    pol = scipy.interpolate.lagrange(x, y)
    p = depict.point(x, y, show_plot=False, color='Red',
                     title='Lagrange - {}'.format(i))
    p += depict.line(x=np.linspace(0, 1, 1000),
                     y=scipy.polyval(pol, np.linspace(0, 1, 1000)),
                     show_plot=False)
    p_all.append(p)
depict.show(np.reshape(p_all, (2, 2)))
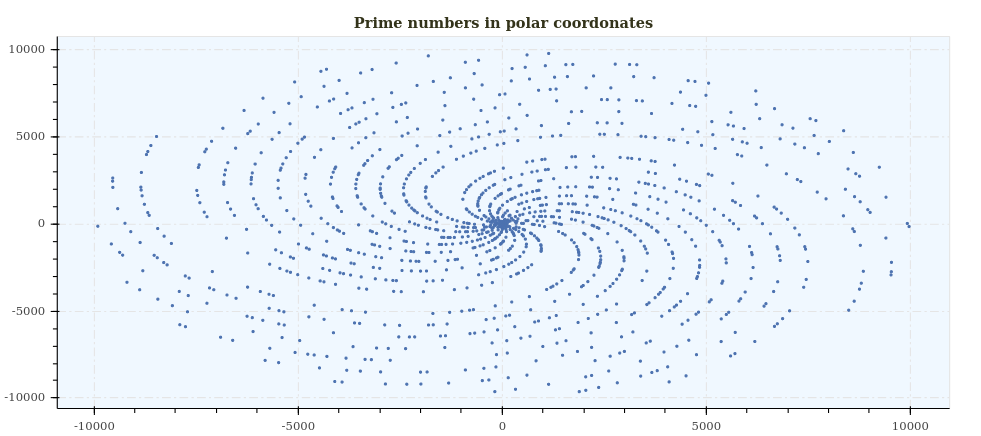
import depict
import numpy as np

def is_prime(n):
    if n % 2 == 0 and n > 2:
        return False
    return all(n % i for i in range(3, int(np.sqrt(n)) + 1, 2))

x = [i * np.sin(i) for i in range(10000) if is_prime(i)]
y = [i * np.cos(i) for i in range(10000) if is_prime(i)]
depict.point(x, y, title='Prime numbers in polar coordonates', size=2)
More about the maths here: https://www.youtube.com/watch?v=EK32jo7i5LQ
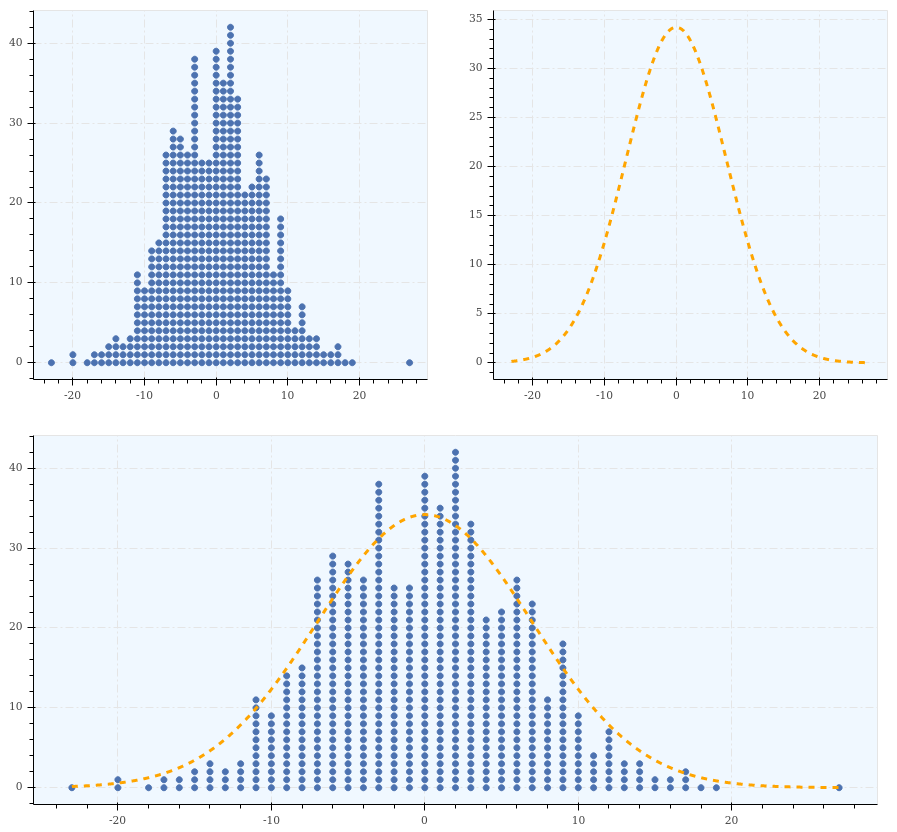
from collections import Counter
from itertools import repeat

import depict
import numpy as np
import scipy

normal = np.round(np.random.normal(size=600, scale=7))
counter = Counter(normal)
rg = np.arange(normal.min(), normal.max() + 1)

y = np.concatenate([range(counter[i]) for i in rg])
x = np.concatenate([list(repeat(i, counter[i])) for i in rg])
p_point = depict.point(x, y, show_plot=False)

x = np.linspace(normal.min(), normal.max(), num=1000)
y = scipy.stats.norm.pdf(x, loc=0, scale=7) * 600
p_line = depict.line(x=x, y=y, color='Orange', style='-',
                     line_width=3, show_plot=False)

depict.show([[p_point, p_line], p_point + p_line])